You have probably seen some version of this curve at some time or another:

The blue lines are drawn by putting  evenly spaced points in the interval
 ![[0,1]](https://s0.wp.com/latex.php?latex=%5B0%2C1%5D&bg=ffffff&fg=393939&s=0&c=20201002) for both the horizontal and vertical axis and connecting them.
for both the horizontal and vertical axis and connecting them.
As approaches infinity, the question is, what is the area occupied by the blue lines? The area is clearly finite since the entire shape is bounded by a 1×1 square, but how much of that square is occupied?
Intuitively it might seem that the blue curve is a circle, however that intuition is wrong. In the above diagram, the red curve is the actual circle, and clearly the blue curve is outside the circle. But fortunately the area can be found with some calculus.
If we choose some point  on the x-axis, then obviously that point is connected to point
  on the y-axis. The slope of this line is
  and the equation of this line is
 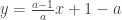 . More conveniently, we can this expression as
  , intuitively the line formed when we choose
  as our x-axis point.
Let  be the bounding curve for the blue lines. To find , we want to choose the value , given
  , so that is maximized. To do this, we take the partial derivative
  :
:
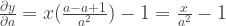
The optimal value of is the one for which  , so solving for we get
  . Then we have


Integrating from 0 to 1 gives us the answer:


Hi! Thank you for your interesting blogg. I was wondering if you could explain something that is not obvious for me. You say that to find f(x) we have to find a that maximizes g(a,x). What does it mean exactly to maximize a straight line?
LikeLike
Oh. What I meant wasn’t that g(a,x) itself is a straight line; rather if we ‘fix’ a and have the function y=g(a,x) as a function of just x, then we have a straight line. To maximize this would be to choose a so that y=g(a,x) is maximized at that point (again fixing a). Don’t know if what I said makes any sense xD
LikeLike
Shouldn’t the point (a, 0) be connected to the point (0, 1-a)? What’s b?
LikeLike